WHY DATA-DRIVEN THROWING REHAB GETS BETTER RESULTS
The short version
Hope is not a return-to-throw strategy. Feel-based rehab ignores the metrics that predict re-injury. Here is what data-driven rehab actually tracks.
By Dylan Newcomer, PT, DPT
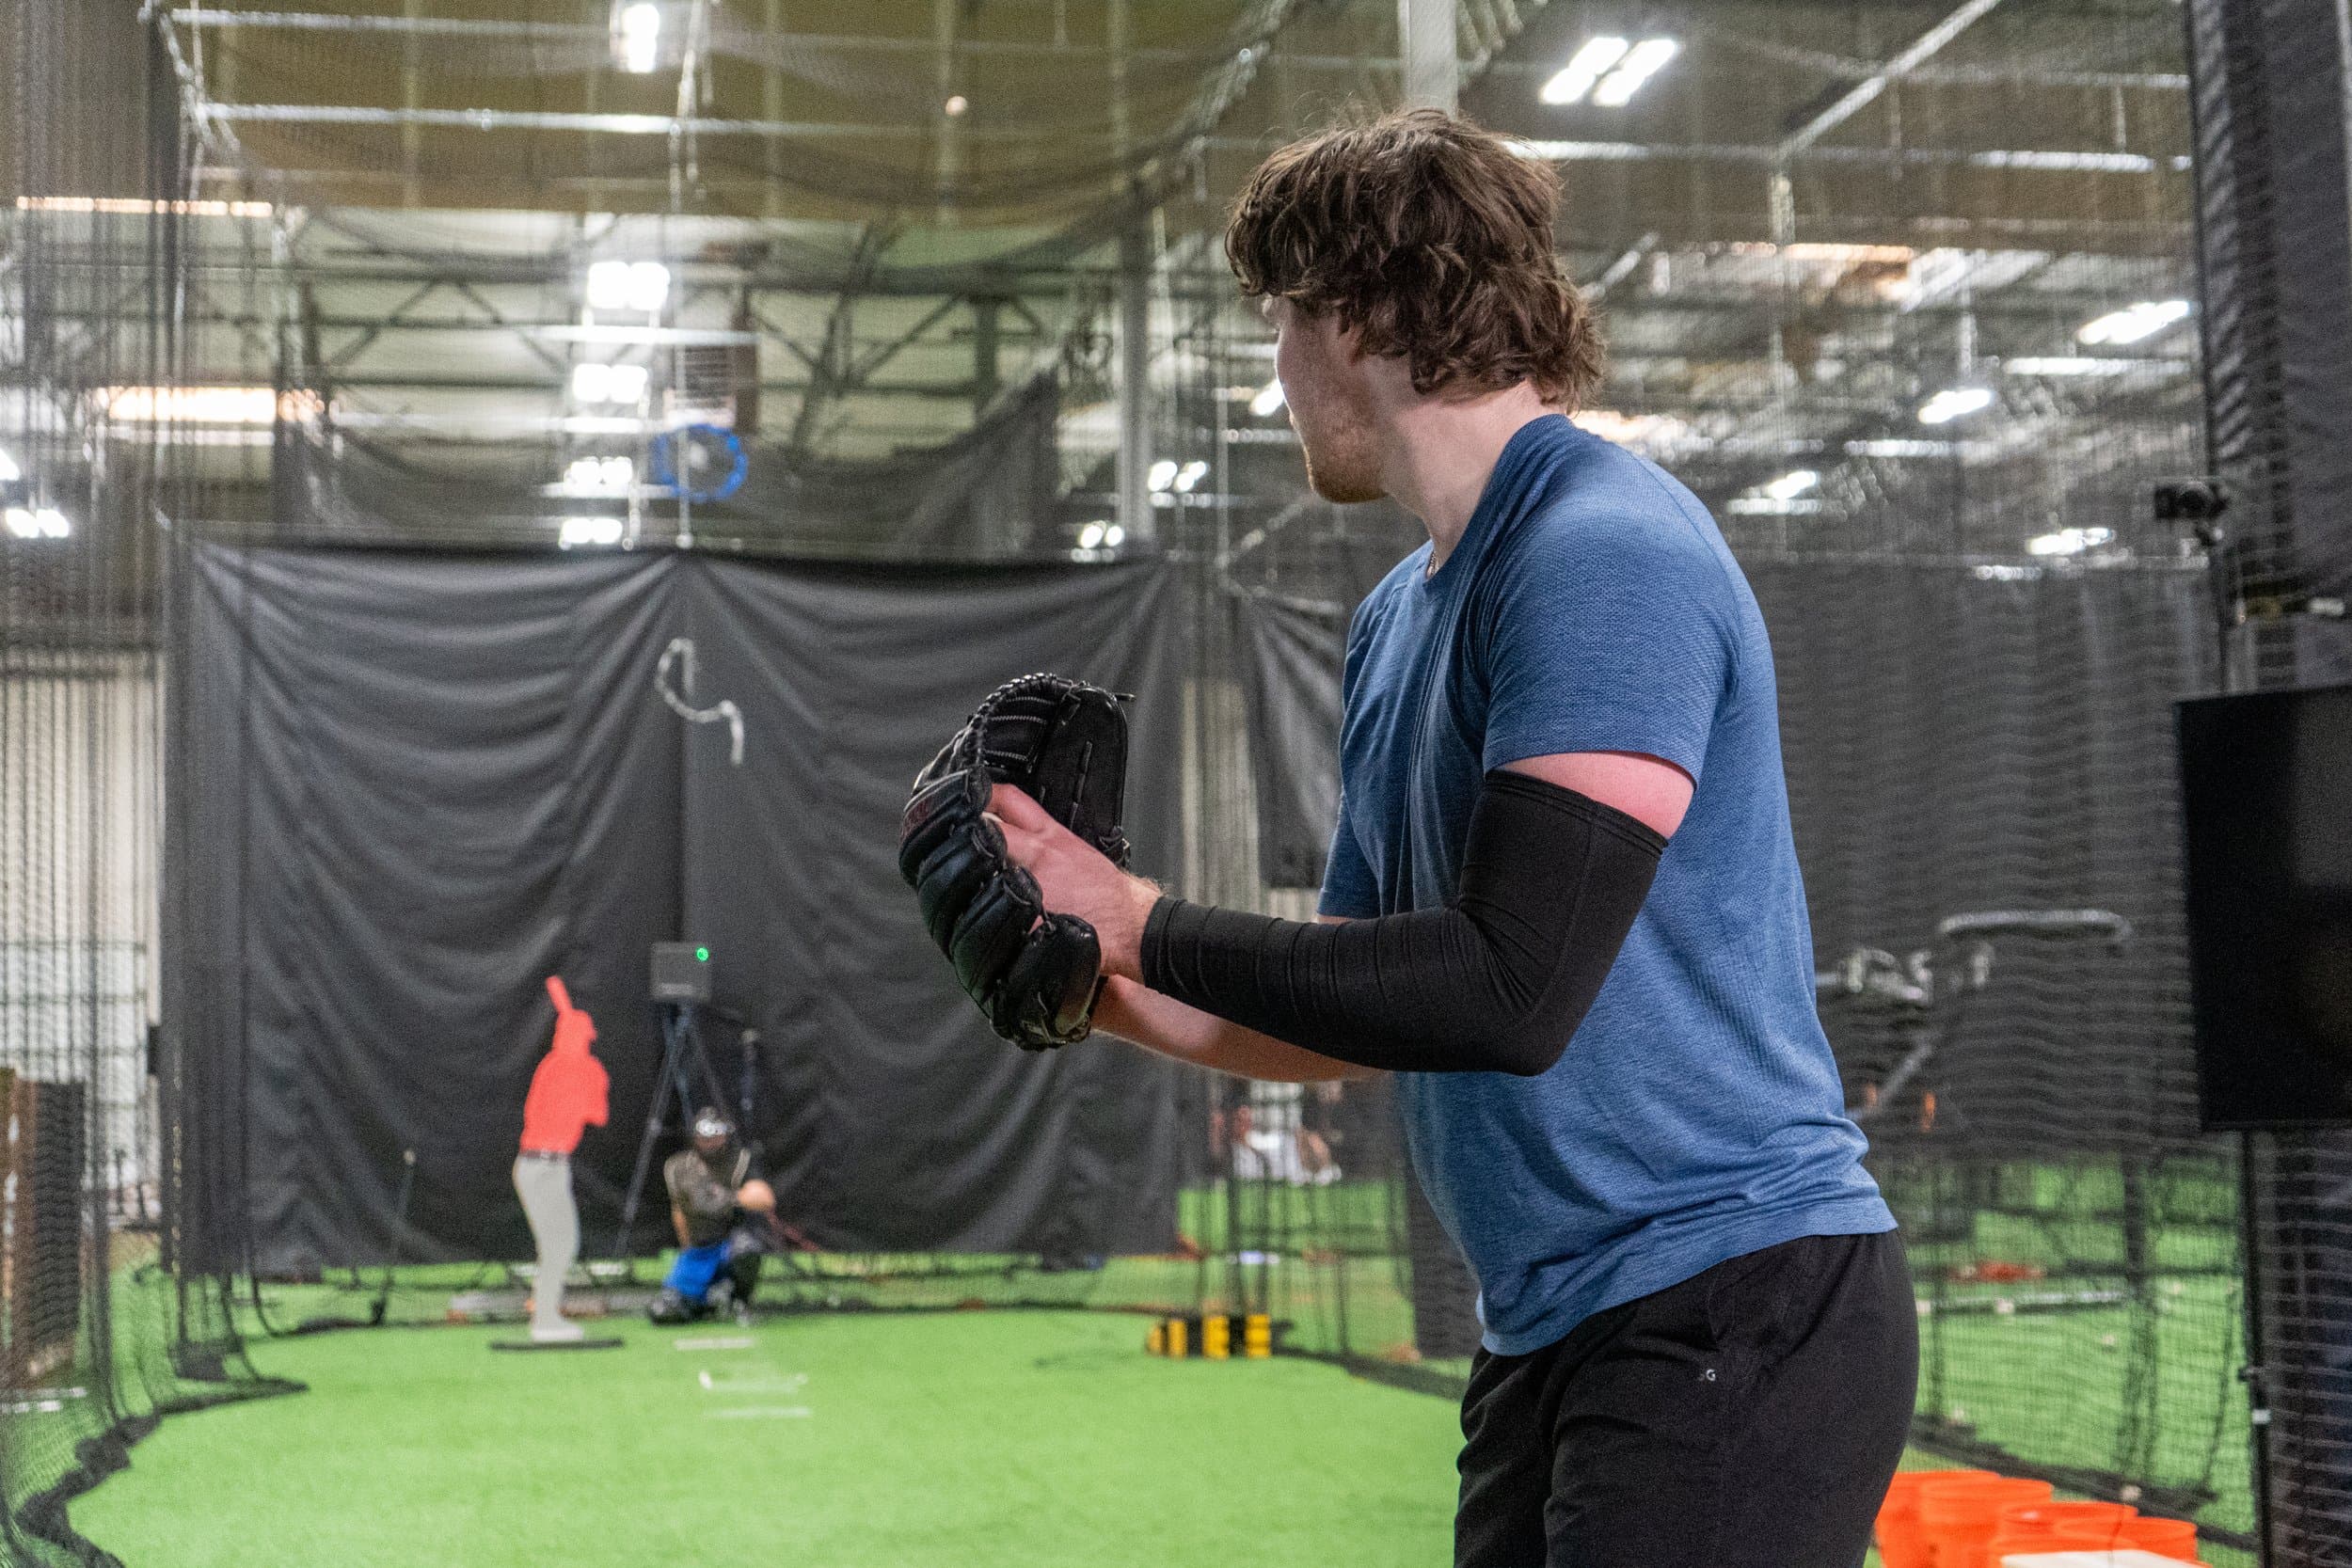
Hope is not a return-to-throw strategy.
But that is exactly what most throwing rehab programs are built on. Rest the arm. Do some band work. Start a long-toss program. Progress when the athlete says he feels good. Cross your fingers. The fact that this approach has been standard for decades does not make it defensible. It means we have been accepting preventable failures for decades.
And the research keeps confirming this. A 2025 systematic review by Huang et al. examined 18 studies covering 2,887 players returning from throwing injuries and found substantial inconsistencies in return-to-play criteria across the board. There is no standardized objective framework. Different surgeons, different PTs, different thresholds, or no thresholds at all. Even more telling: psychological factors accounted for 40.4% of RTP failures. When you do not give athletes clear, objective benchmarks, they either come back too scared to throw or too confident for their tissue to handle. Both are failure modes that data eliminates.
How Feel-Based Programs Fail
There are three specific ways feel-based return-to-throw programs break down.
They miss workload spikes. An athlete "feels great" after two weeks off, so he jumps back to full-intensity throwing. His acute workload skyrockets relative to his chronic base. Mehta et al. (2019) tracked 18 varsity baseball players with wearable elbow sensors over an entire season and found that five of six throwing-related injuries occurred when the acute-to-chronic valgus workload ratio exceeded 1.27. The tissue did not care that the athlete felt fine. It cared about the load spike.
This is not just a rehab problem. It is a systemic preseason problem. Tabaracci et al. (2025) monitored 9 NCAA Division I pitchers with forearm IMUs through preseason and found that ACWR exceeded the 1.27 injury threshold in weeks 1, 2, 3, and 5 of the ramp-up. Four out of five monitored weeks above the danger line. These are healthy college pitchers in a structured program, and their workloads are routinely spiking into injury territory because nobody is actually watching the numbers. Now imagine a post-surgical athlete ramping up without this monitoring. That is the gap we are talking about.
They use time as a proxy for tissue readiness. A systematic review by Anderson et al. (2022) examined return-to-competition criteria after UCL reconstruction across 15 studies. The most common criterion - used in 73% of studies - was simply minimum time from surgery: wait 9 to 12 months, then go. That is a calendar-based decision, not a capacity-based one. Nowhere in those protocols is there a requirement to demonstrate that the arm can actually handle competitive workload before returning to it.
They ignore the velocity-stress relationship. Pitch velocity is one of the most reliable indicators of elbow valgus torque. Fortenbaugh, Fleisig, and Andrews (2009) established that higher ball velocity directly correlates with increased shoulder and elbow kinetics, and that pitchers who averaged more than 80 pitches per appearance were nearly four times more likely to require surgery. If your rehab program is not tracking velocity at every session, you have no idea how much stress your athlete is actually putting on the arm - even when the throw count looks reasonable. Velocity without context is a blind spot.
This is also why better mechanics alone will not save your UCL. Mechanical efficiency increases velocity, which increases torque. The stress-capacity equation does not care how clean the arm action looks.
And external factors are shifting the stress landscape in ways that were not on anyone's radar five years ago. Mastroianni et al. (2025) analyzed UCL injury patterns before and after the MLB pitch clock and found something unexpected: overall UCL surgery rates did not change, but the profile of who gets hurt did. Pitch-clock-era injuries involved pitchers with higher preinjury workload who were 2.5 years younger, with a concentration of injuries in the first two months of the season. The rule change did not create more injuries. It redistributed them toward younger arms ramping up faster. If your rehab program is not accounting for the actual competitive demands your athlete is returning to, including things like pace-of-play rules, you are preparing him for a game that does not exist anymore.
What Data-Driven Actually Means
"Data-driven" is not a marketing term. It is a specific set of metrics tracked at every session that replace subjective judgment with objective thresholds. Here is what we track in our Driveline Baseball rehab program:
-
Ball velocity. The actual progression variable. Velocity is the best available proxy for elbow stress outside of a biomechanics lab. It is the single variable most directly correlated with valgus torque. So it is the variable we use to drive every progression decision. Not distance. Not arbitrary effort percentages. Actual ball speed, tracked at every session, compared to the athlete's own pre-injury baseline. If a pitcher threw 88 mph before surgery, we know exactly where he sits relative to that number at every point in his rehab, and that tells us more about the stress on his arm than any "throw from 90 feet" instruction ever could.
-
Throw count and volume. Total throws per session matter, but only in the context of the velocities they were thrown at. Twenty throws at 75 mph and twenty throws at 88 mph are not the same session. We track both.
-
Acute-to-chronic workload ratio (ACWR). This is the ratio of recent throwing load (typically one week) to the rolling average load over a longer window (typically four weeks). The research supports keeping this ratio between 0.8 and 1.3. Spikes above that range are where injuries cluster. The current gold-standard for structured return-to-throw. The updated interval throwing program from Reinold et al. (2024), was specifically redesigned around this principle. They extended the original 136-day Wilk program to 217 days and in doing so kept ACWR within the 0.7–1.3 safe zone for 91% of the program, up from 82% in the original. The extra time is not arbitrary padding. Every additional day exists to prevent the exact workload spikes that Mehta's data flagged as injury triggers. Faster is not better. Controlled is better.
-
Strength benchmarks, but the right ones. Grip strength, forearm pronation and supination strength, shoulder internal and external rotation strength at 90 degrees of abduction. These are gating criteria. If the numbers are not there, the athlete does not advance, regardless of how his arm feels. But the nuance matters here, because not all strength data is created equal. Erickson et al. (2024) studied 213 professional pitchers and found no difference in baseline grip strength between injured and uninjured groups, injured pitchers actually had slightly higher final-season grip strength. Static grip alone does not predict injury. So what does? Erickson et al. (2025) followed 41 minor league pitchers and measured grip decline during games. Grip strength dropped from 124.5 pounds pregame to 113.1 pounds by the fourth inning across the board, but injured pitchers showed steeper declines, falling to roughly 74.5% of uninjured values by the sixth inning. The meaningful fatigue marker is not how strong the grip is at rest. It is how fast it deteriorates under load. That is why we test grip before and after throwing sessions, not just once during an eval. The rate of decline tells you whether the forearm musculature can sustain the protective role it plays for the UCL across an entire outing.
-
Movement quality via video. Mechanical assessment is not the primary injury prevention lever, but it matters for identifying specific faults that create localized tissue irritation. We use it to flag problems, not to chase an aesthetic ideal.
The Technology Is Catching Up
One of the legitimate criticisms of data-driven rehab has been the technology barrier. Lab-grade biomechanics analysis is expensive and inaccessible. Wearable sensors have been promising but imperfect.
That criticism is getting harder to sustain. Camp et al. (2021) independently validated the motusBASEBALL sensor (now PULSE) against motion capture and found significant correlations with lab data, though it consistently underestimated absolute values. That means it is not a replacement for a Driveline or ASMI-style motion capture session when you need precise numbers. But it is reliable for tracking within-pitcher changes over time, which is exactly what rehab monitoring needs. You do not need to know the exact valgus torque in Newton-meters. You need to know whether today's session is loading the arm more or less than last week's session for the same pitcher.
And the next generation is closing the gap fast. Greenberg et al. (2025) validated a wrist-worn device called PhySens that hit 99.4% pitch detection sensitivity, velocity correlation of r = 0.96, and valgus torque correlation of r = 0.95, all within 1.5 mph of actual velocity. The key feature: it captures every throwing exposure automatically. No manual logging, no forgetting to record bullpen sessions, no underreporting warm-up throws that still count as tissue load. When every throw is captured, ACWR calculations actually reflect reality instead of whatever the athlete remembered to write down.
We are not at the point where every athlete in rehab needs a sensor on their wrist. But we are past the point where "we cannot measure that" is a valid excuse for ignoring workload data.
How Data Changes the Decision
Here is a concrete example of how this plays out.
A college pitcher is 14 weeks post-UCL reconstruction. He threw 88 mph pre-injury. He is in Phase 3 of his return-to-throw program and reports feeling "100%." In a traditional program, the next move is to increase his distance or tell him to bump up to "75% effort", whatever that means.
In our program, we check the numbers. His velocity ceiling this week is 72 mph. That puts him at 82% of his pre-injury baseline. His ACWR from the last seven days is 1.35, above the safe zone. His grip strength on the throwing side is 82% of the non-throwing side, below our 90% threshold. And his grip decline across the session is steeper than the previous week, forearm fatigue is outpacing his current tissue tolerance.
He feels great. The data says he is not ready to progress his velocity ceiling. We hold him at the current tier for another week, manage his volume to bring the ACWR back in range, and add targeted forearm loading to close the grip strength gap. The next velocity progression happens when those numbers say it is safe, not when he feels like throwing harder.
This is the difference. Most return-to-throw programs (including the ones considered industry standard) are still built around the wrong variables. Distance-based programs tell you to throw from 60 feet, then 90, then 120, then get on a mound. Effort-based programs tell you to throw at "50%," then "75%," then "90%." Both have the same fundamental problem: neither one measures the thing that actually loads the UCL.
Distance tells you nothing about arm stress. A lazy throw from 120 feet and an aggressive throw from 60 feet can produce completely different elbow torques. And "75% effort" is meaningless, ask ten pitchers what 75% feels like and you will get ten different answers. It is not a metric. It is a guess wearing a number.
Velocity is the variable. It is measurable, repeatable, and directly correlated with the forces on the arm. When you progress based on velocity (not distance, not perceived effort) you are making decisions based on what the tissue is actually experiencing. That is the difference between a protocol and a tradition.
Why This Matters for Your Arm
The gap between traditional throwing rehab and data-driven throwing rehab is not philosophical. It is measurable. One approach asks "does it hurt?" and progresses when the answer is no. The other asks "can the tissue handle the next level of demand?" and has objective criteria for answering that question.
Every metric we track exists to answer one question: is this athlete's tissue capacity keeping pace with the stress we are applying? When the answer is yes, we progress. When it is no, we adjust. No ego. No guessing. No hoping.
If you are recovering from a throwing injury (or trying to prevent one) and your current program does not track any of the metrics above, you are leaving your arm's future to chance.
Schedule a throwing assessment and find out where you actually stand.
THE NEXT STEP
See how velocity zones, workload tracking, strength, and bullpen progression guide the return.
Explore Return to ThrowReady to talk? Book a free consultation →
RELATED POSTS
Your Muscles Fail Before Your UCL Does: The Deep Science of Tommy John
The UCL doesn't blow out in isolation. It fails when the muscles protecting it can no longer do their job — whether they yield from fatigue or lock from damage. Here's exactly what happens inside the elbow, pitch by pitch.
Read More →
Dead Arm in Baseball: Four Causes, One Nobody Catches
"Dead arm" is not one thing. It's four different problems — and the most underdiagnosed one is caused by a coaching cue every pitcher has heard.
Read More →
Better Mechanics Won't Save Your UCL: Here's Why
"Fix his mechanics" is baseball's most common advice, and a logical fallacy. The research says tissue capacity and workload are what actually matter.
Read More →